
Welcome to iTOL!
 Firefox toolbar
Recent changes
Version 3.0
- Complete rewrite of the backend tree storage system
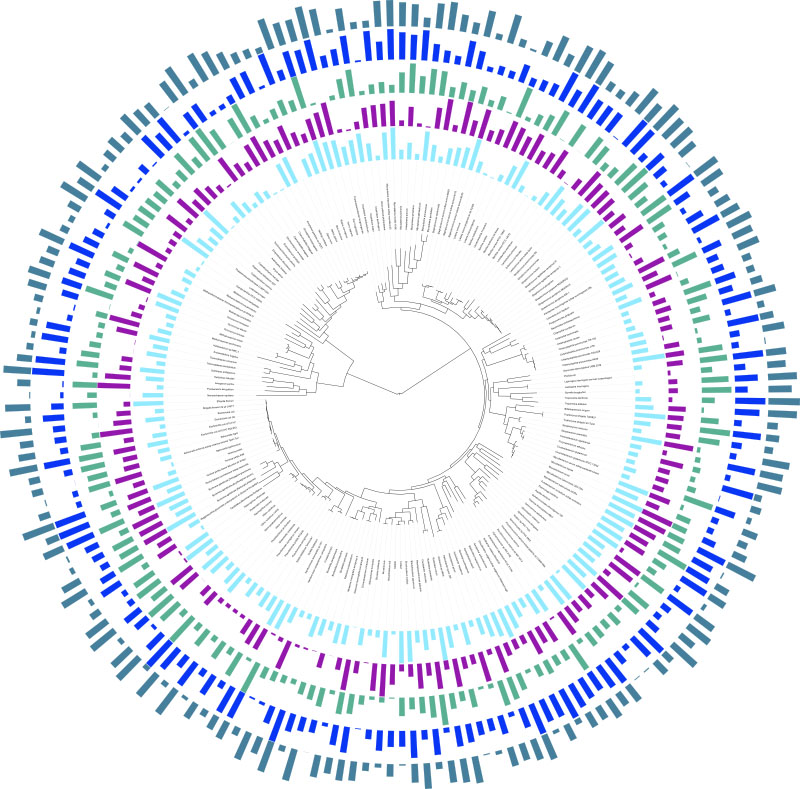
- Additional tree can be displayed above the heatmap datasets
- Support for display of custom scales in several dataset types
- Various minor updates and bug fixes
Version 2.2.2
- Collapsed clades can be exported with same size and font as regular leaves
Version 2.2.1
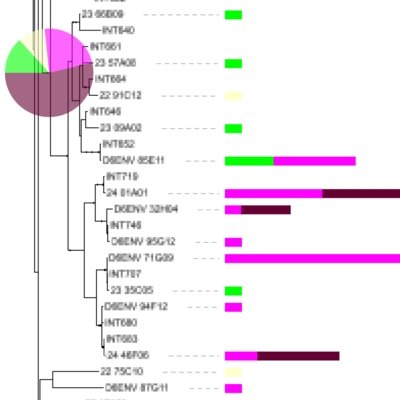
- Colored strip and gradient datasets support values assigned to internal tree nodes. These values will only be displayed when assocated clades are collapsed.
- Collapsed clades can be displayed with simplylified triangles, taking less space
Version 2.2
- multiple binary datasets will be automatically spread to prevent overlap
- If labels are present in a color strip dataset, a legend containing the labels will be added to exported trees
Version 2.1.1
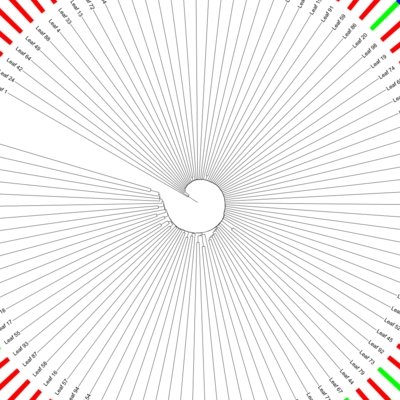
- branches can be marked with custom labels
- Dataset legends are optional in exported trees
Version 2.1
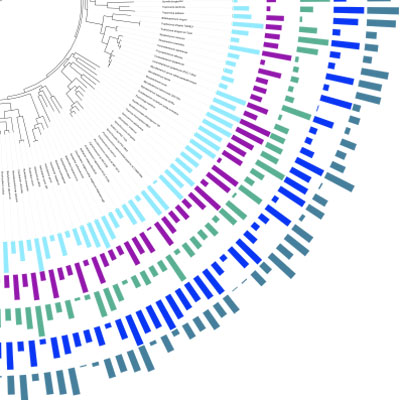
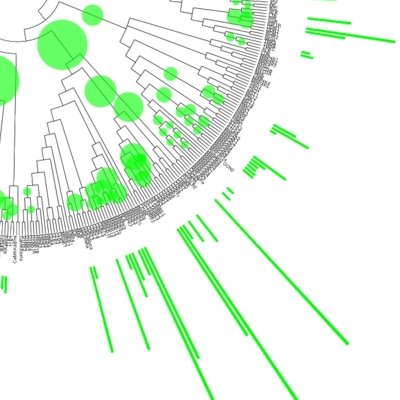
- New dataset type: circles
- Several datasets (binary, bar chart, multi-value bar chart, protein domains) support display of values assigned with internal nodes of the tree. These values will only be displayed when assocated clades are collapsed.
Version 2.0.1
- Pie chart position on each branch can be defined: example
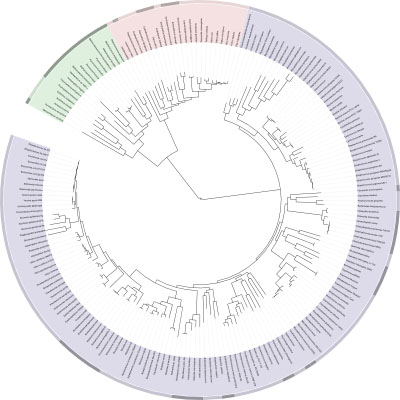
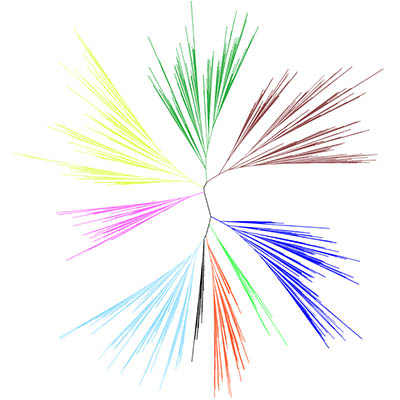
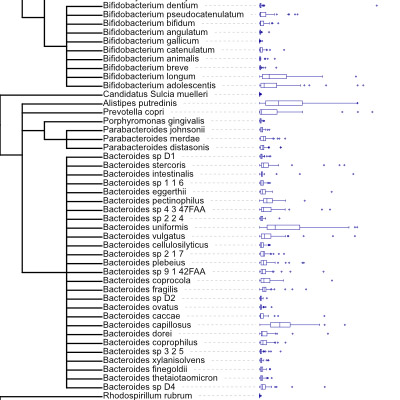
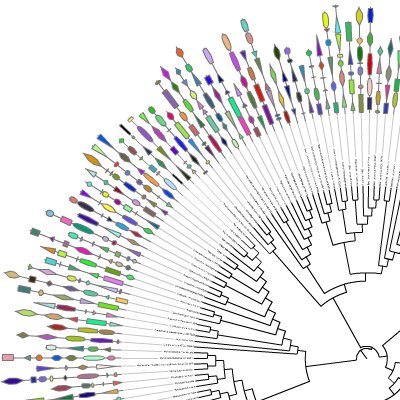
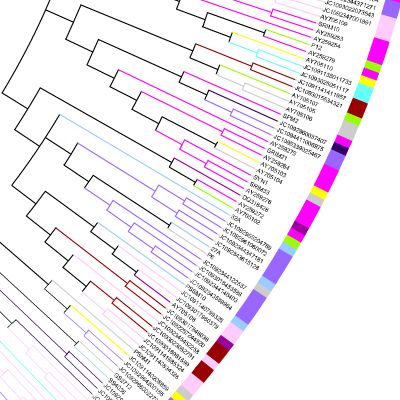
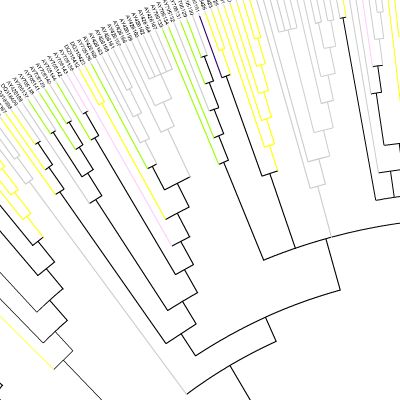
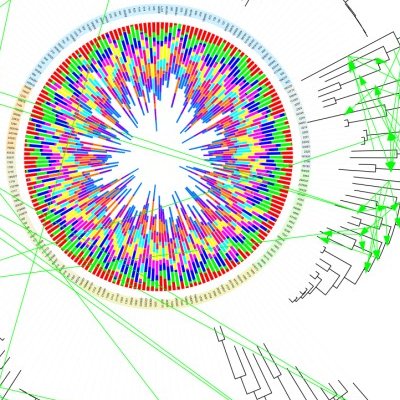
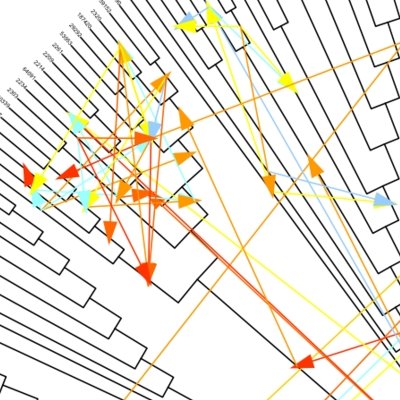
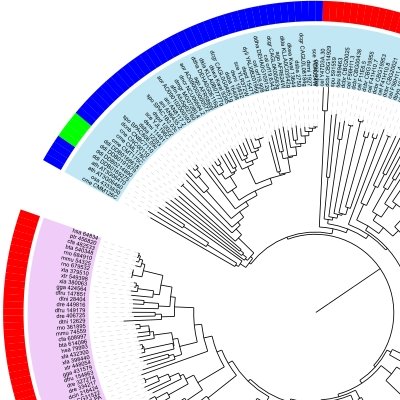
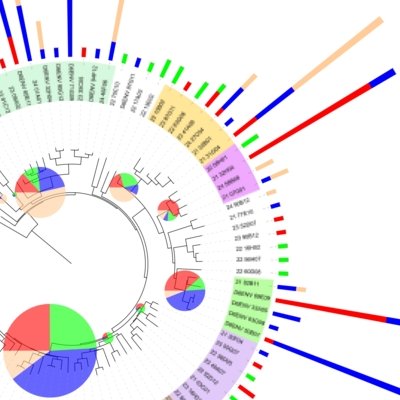
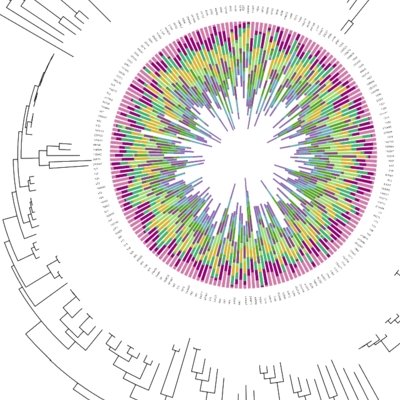
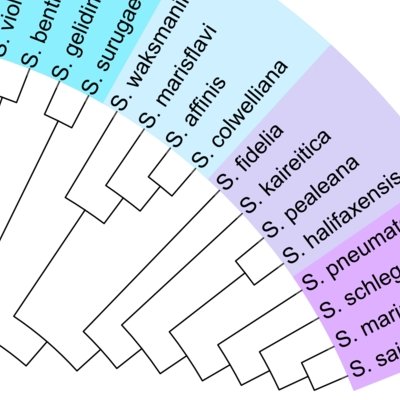
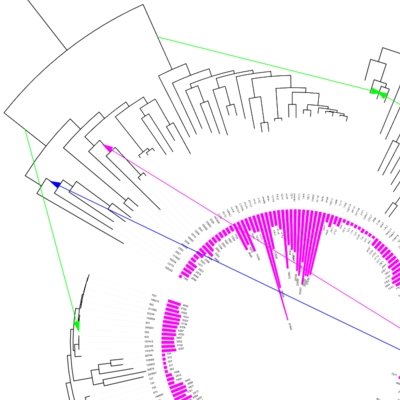
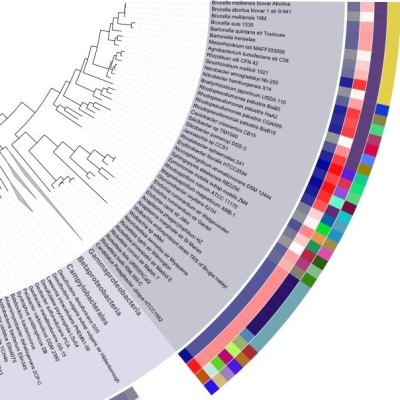
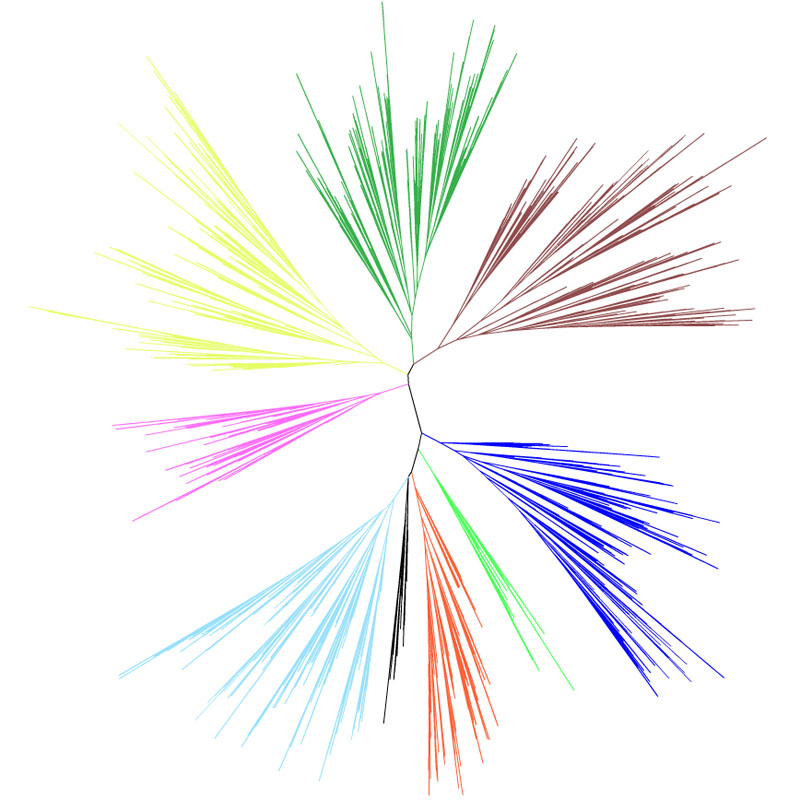
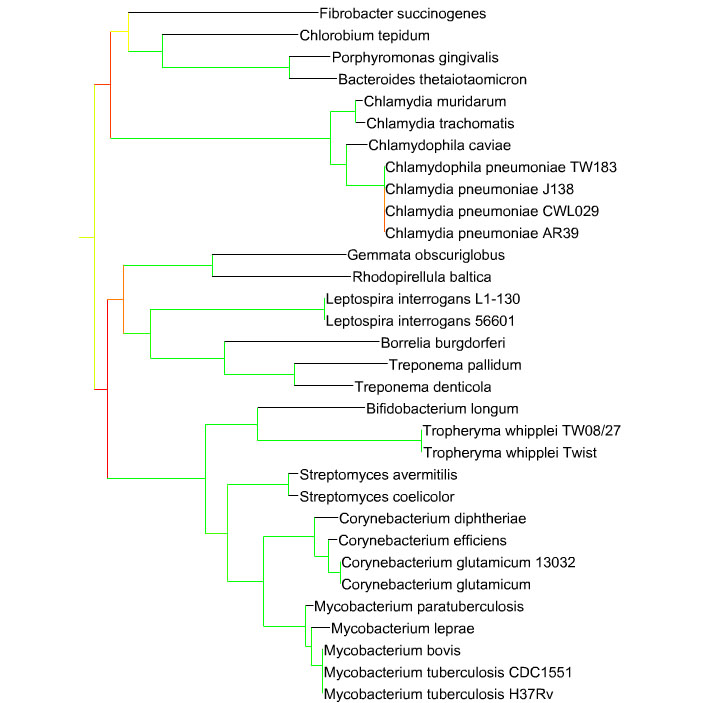
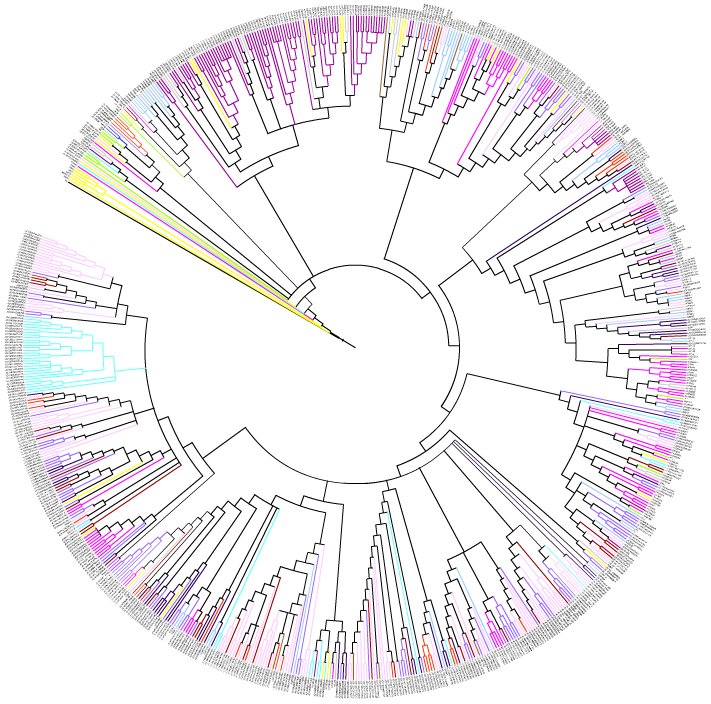
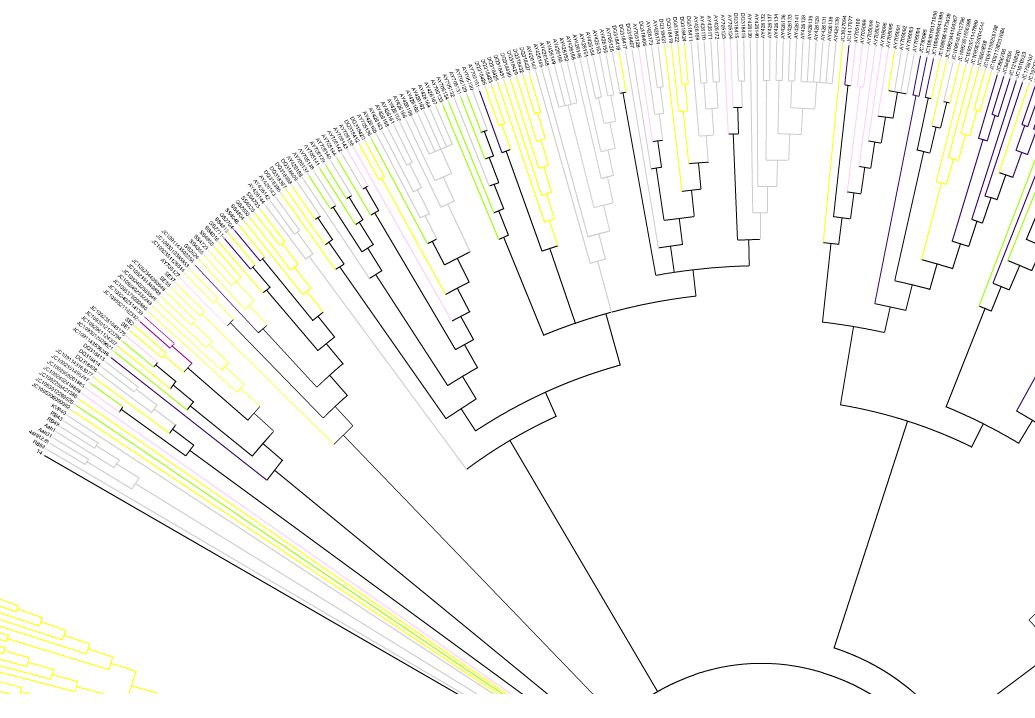
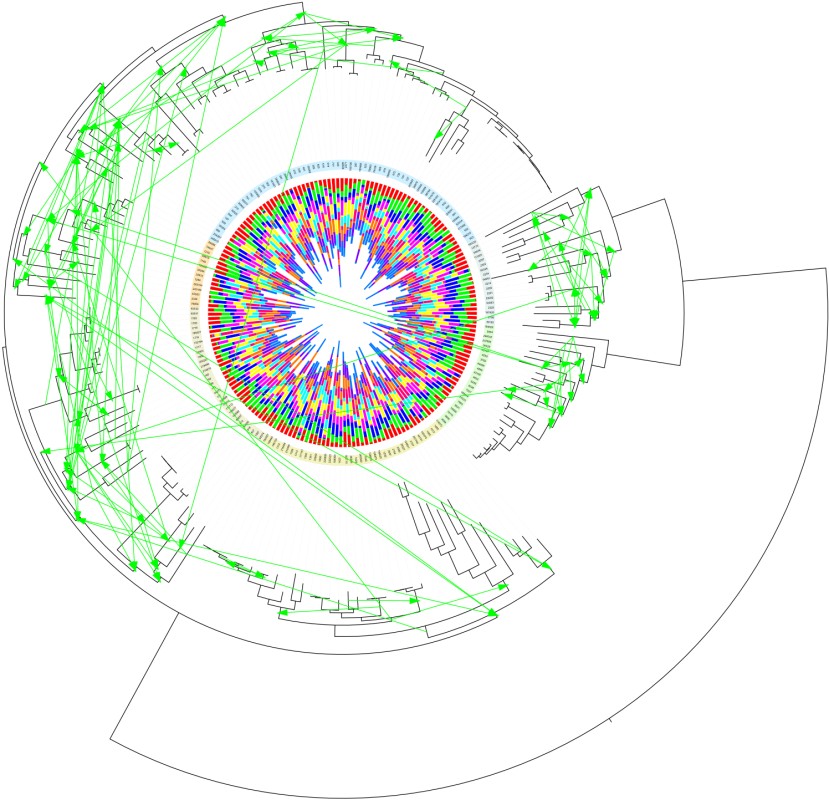
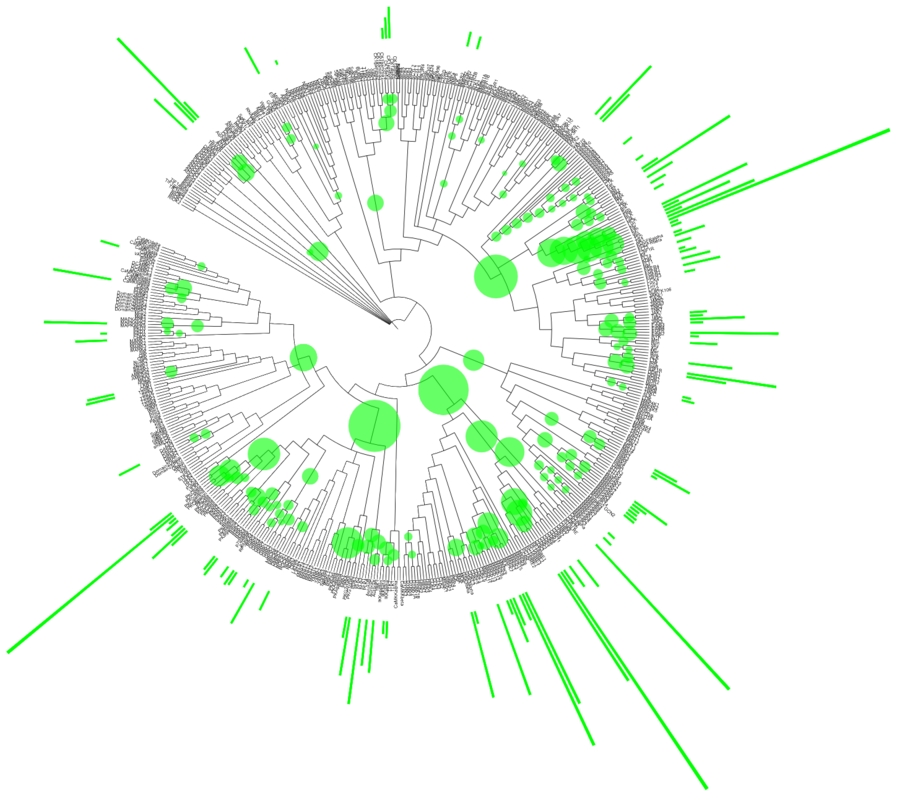
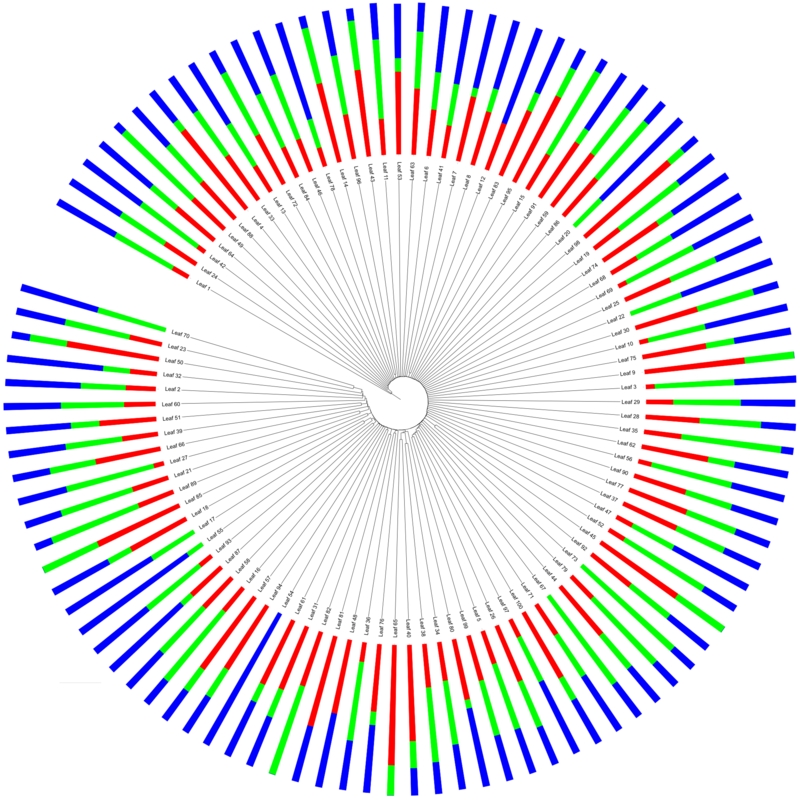
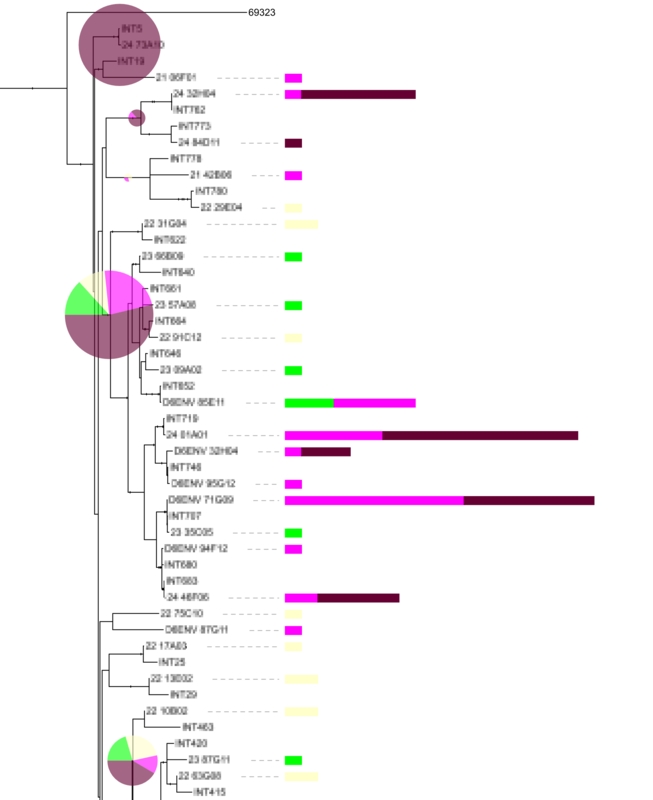
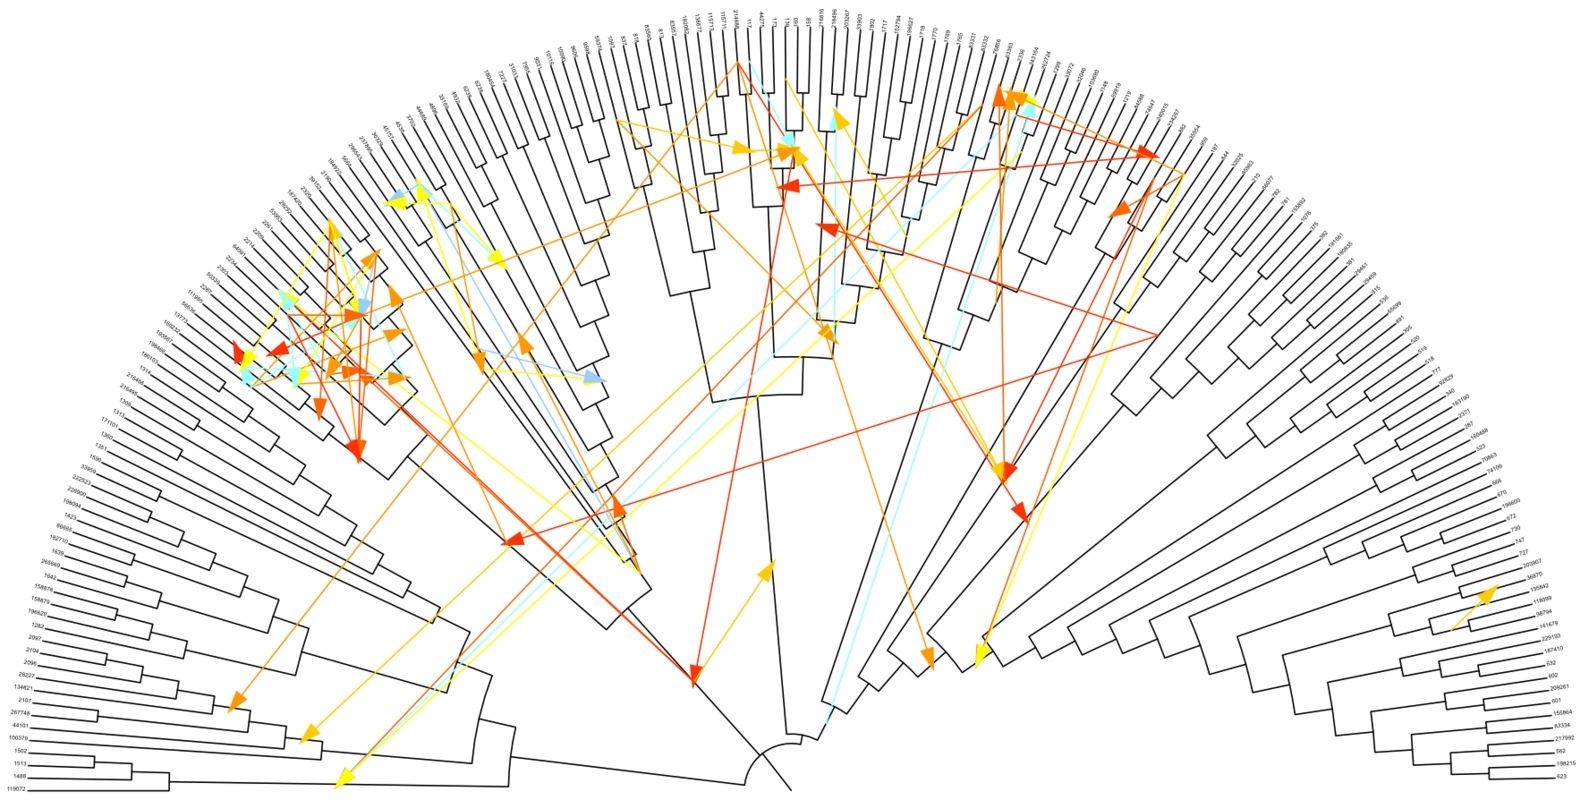
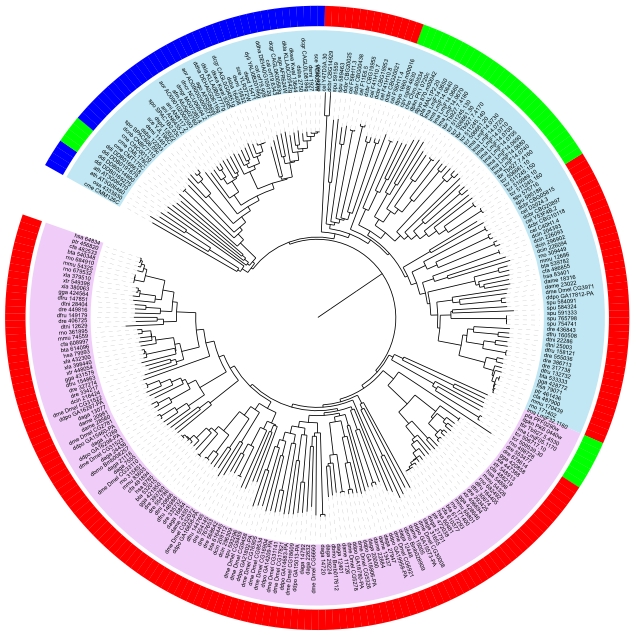
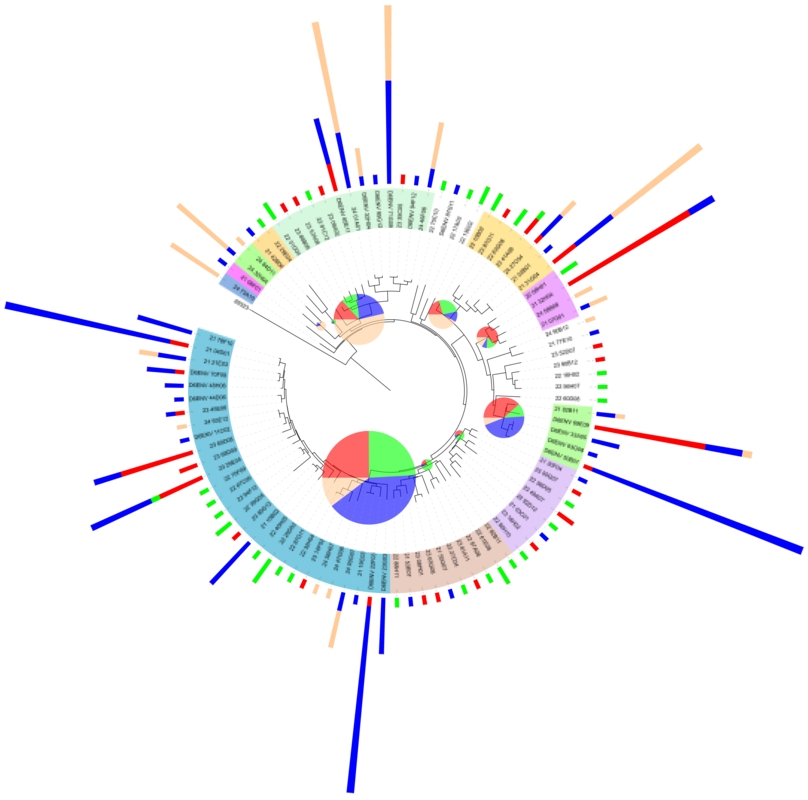
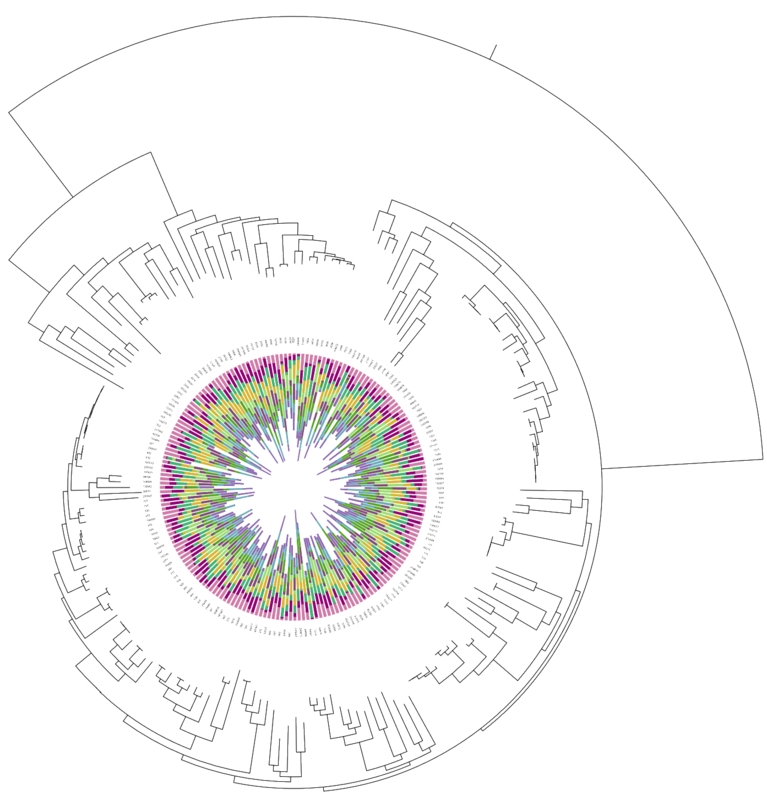
Interactive Tree Of Life is an online tool for the display and manipulation of phylogenetic trees. It provides most of the features available in other tree viewers, and offers a novel circular tree layout, which makes it easy to visualize mid-sized trees (up to several thousand leaves). Trees can be exported to several graphical formats, both bitmap and vector based. more...
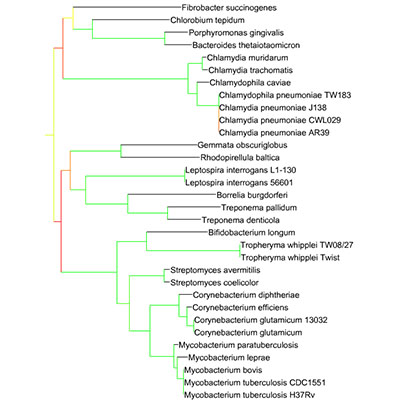
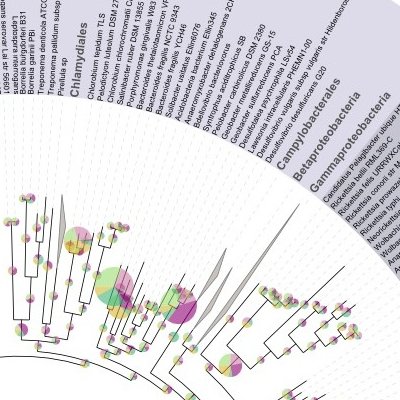
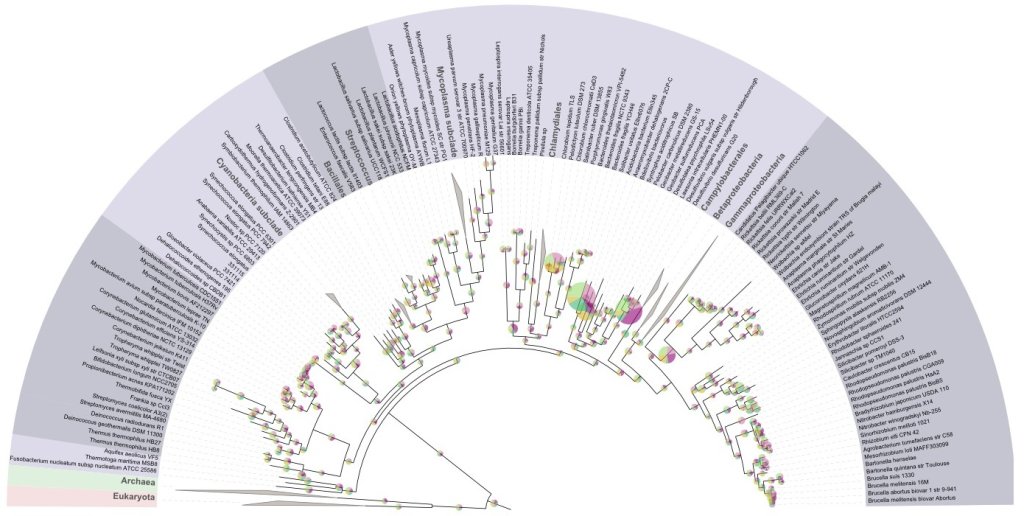
There are several pre-computed trees available for display, including the main Tree Of Life, described in Ciccarelli, et al., 2006. In addition to the precomputed trees, you can upload and display your own trees and data, using the 'Data upload' page or through your personal user account.
Use the tabs on the top of the page to navigate or click the tree below to proceed to the interactive Tree of Life page. Extensive help pages, which provide detailed explanation of iTOL's interface and functions, are available. For further questions, comments or suggestions, please contact us.
If you find iTOL useful in your work, you can cite Letunic and Bork, 2006.
- Version 2.1 introduces a new dataset type, circles. Recent additions also include the ability to assign dataset values with internal nodes. These will be displayed only when assocated clades are collapsed. Check the Help pages for details.
- Second iTOL article was published in 2011 NAR Web server issue (abstract, full text PDF).